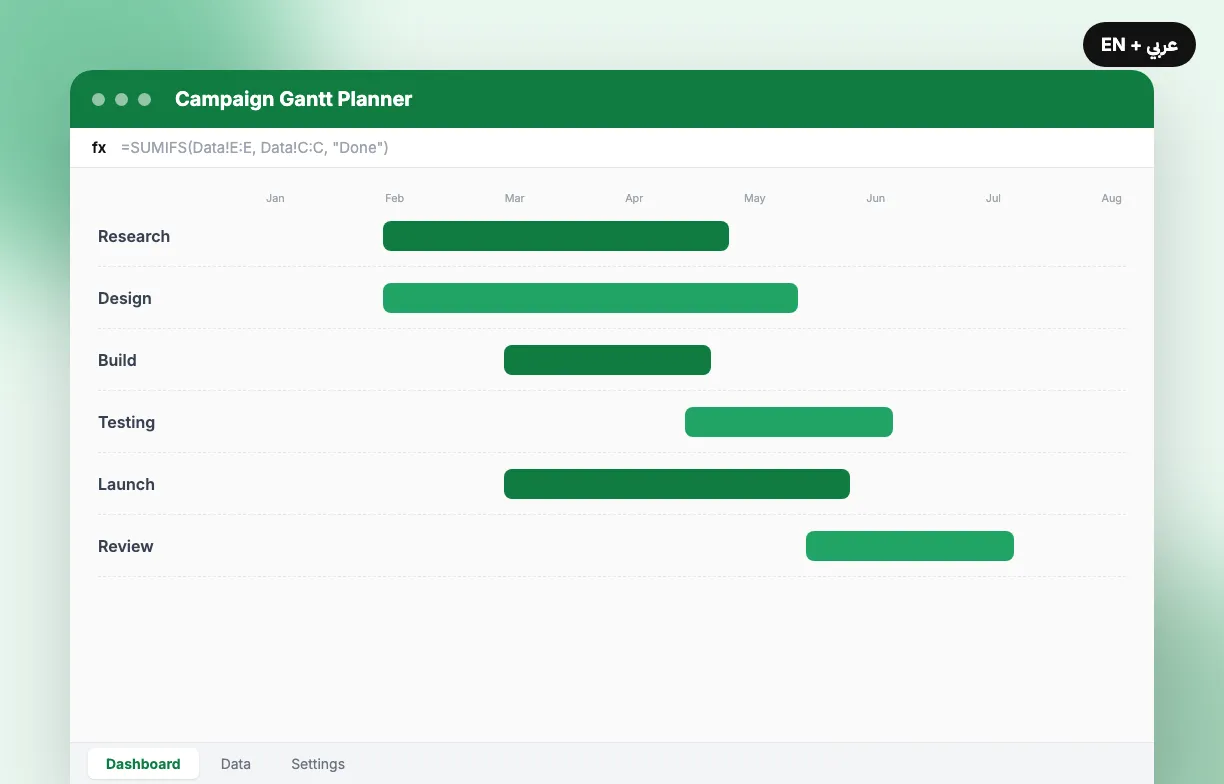
A Gantt chart in a spreadsheet does not need macros. Four columns and one conditional-formatting rule are enough to turn a task list into a timeline the whole team can read.
1. One row per task
- Task name
- Owner
- Start date
- Duration in days, with End = Start + Duration
2. Draw the bars with a rule
Put dates across the top row, then select the grid and add a conditional-formatting rule such as =AND(G$4>=$C5, G$4<=$D5). Every cell inside a task's dates fills with colour, so moving a date moves the bar.
3. Show what matters
Shade weekends with a second rule based on WEEKDAY, add a Status column (Planned, In progress, Done), and colour the bar by status so late work stands out.
Keep the file in one shared place, such as OneDrive, SharePoint or Google Drive, so nobody edits an old copy.



 5 Nov 2026 · 1 min read